Turns a ggplot into a list of plots, showing data incrementally by groups.
Note that if the group aesthetic is not explicitly defined in the original
plot, ggplot2 will set it to the interaction of all discrete variables (see
ggplot2::aes_group_order).
Arguments
- p
A ggplot2 object
- order
(optional) A numeric vector specifying in which order to reveal the groups
For example, if there are three groups in the plot,
order = c(3, 2, 1)will invert the order in which they are revealed.Any group not included in the vector will be omitted from the incremental plots. E.g.: with
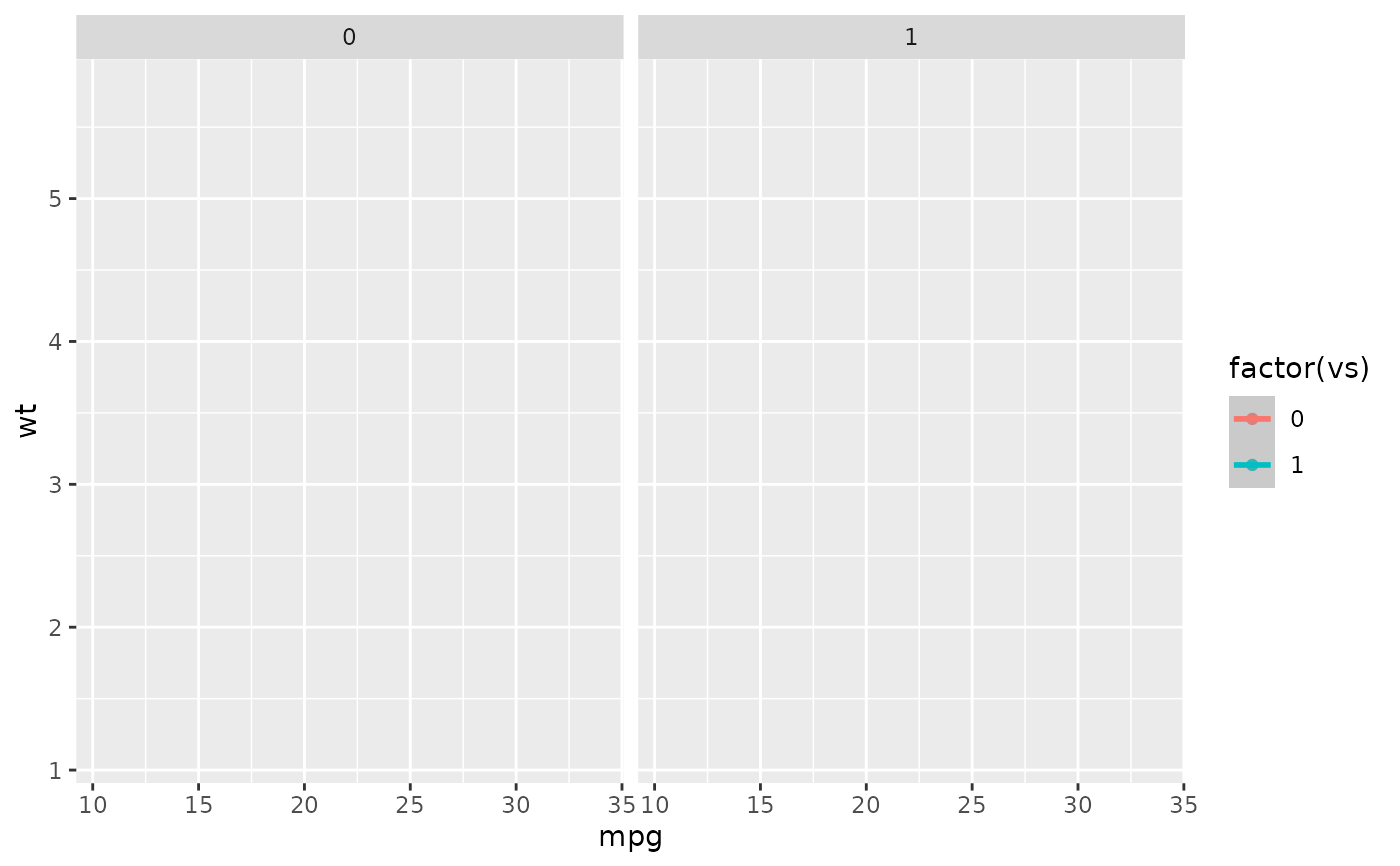
order = c(3, 1), the second group is not shown.By default, the first plot is blank, showing layout elements (title, legends, axes, etc) but no data. To omit the blank plot, include
-1: e.g.order = c(-1, 3, 1), ororder = -1.
Value
A list of ggplot2 objects, which can be passed to reveal_save()
Examples
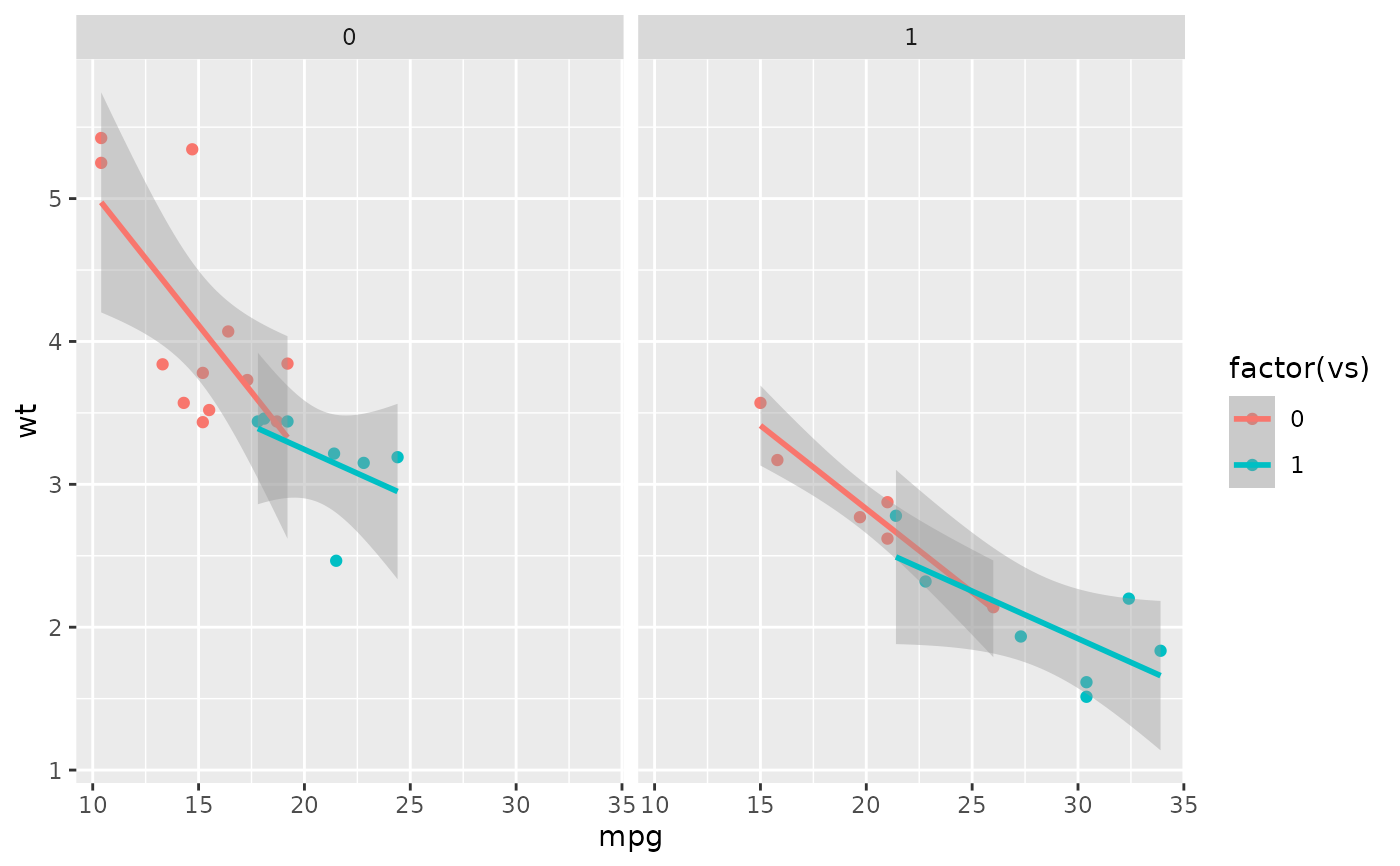
# Create full plot
library(ggplot2)
data("mtcars")
p <- ggplot(mtcars,
aes(mpg, wt,
color = factor(vs),
group = factor(vs))) +
geom_point() +
geom_smooth(method="lm",
formula = 'y ~ x',
linewidth=1) +
facet_wrap(~am)
p
 plot_list <- reveal_groups(p)
plot_list[[1]]
plot_list <- reveal_groups(p)
plot_list[[1]]
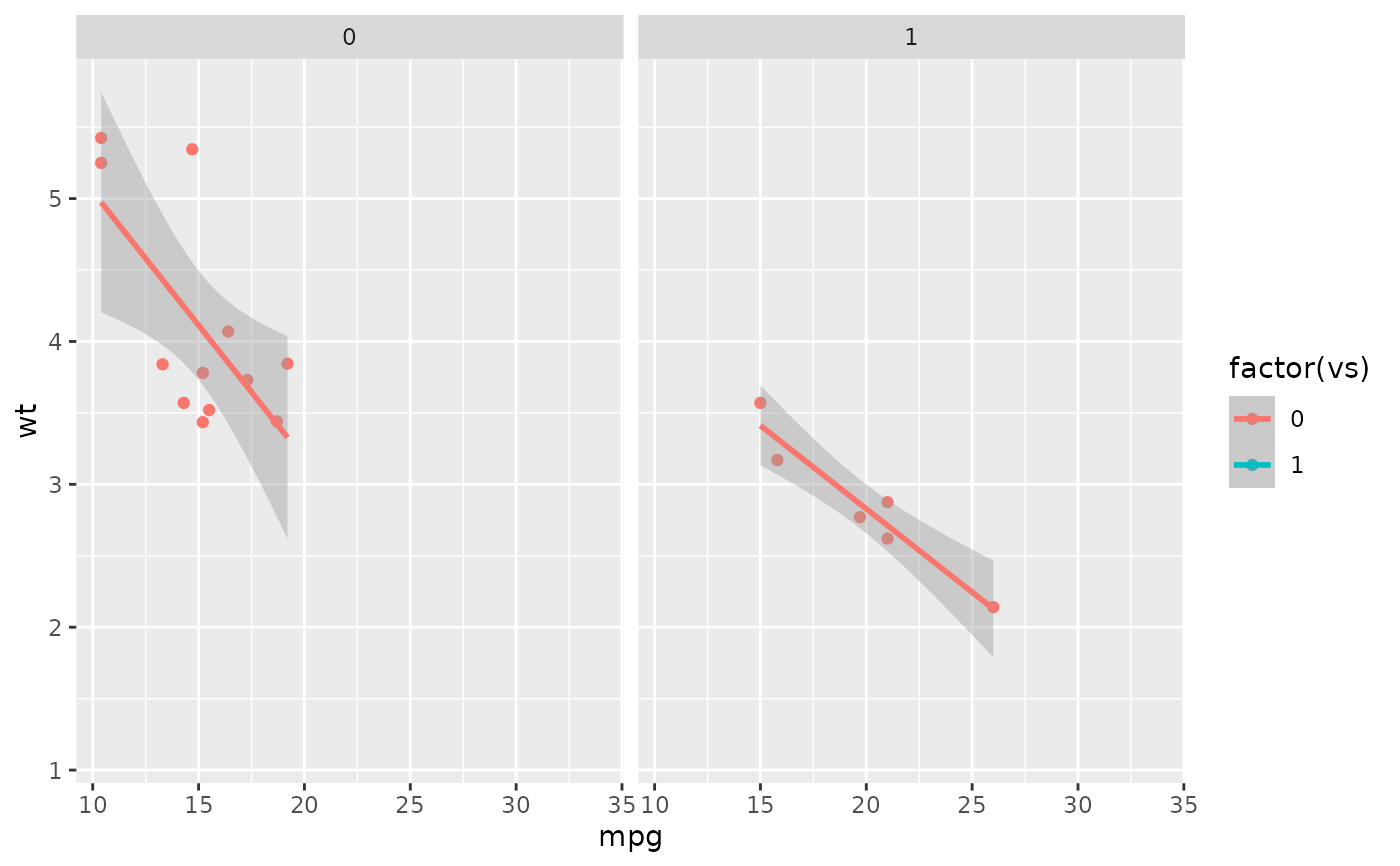
 plot_list[[2]]
 plot_list[[3]]
 # Save plots
reveal_save(plot_list, "myplot.png", width = 8, height = 4, path = tempdir())
#>
#> ── Saving incremental plots ──
#>
#> ✔ /tmp/RtmpK1FQo1/myplot_0.png
#> ✔ /tmp/RtmpK1FQo1/myplot_1.png
#> ✔ /tmp/RtmpK1FQo1/myplot_2_last.png
# Clean temp files
file.remove(list.files(path = tempdir(), pattern = "myplot", full.names = TRUE))
#> [1] TRUE TRUE TRUE
# Save plots
reveal_save(plot_list, "myplot.png", width = 8, height = 4, path = tempdir())
#>
#> ── Saving incremental plots ──
#>
#> ✔ /tmp/RtmpK1FQo1/myplot_0.png
#> ✔ /tmp/RtmpK1FQo1/myplot_1.png
#> ✔ /tmp/RtmpK1FQo1/myplot_2_last.png
# Clean temp files
file.remove(list.files(path = tempdir(), pattern = "myplot", full.names = TRUE))
#> [1] TRUE TRUE TRUE