Turns a ggplot into a list of plots, showing data incrementally by layers.
Arguments
- p
A ggplot2 object
- order
(optional) A numeric vector specifying in which order to reveal the layers
For example, if there are three layers in the plot,
order = c(3, 2, 1)will invert the order in which they are revealed.Any layer not included in the vector will be omitted from the incremental plots. E.g.: with
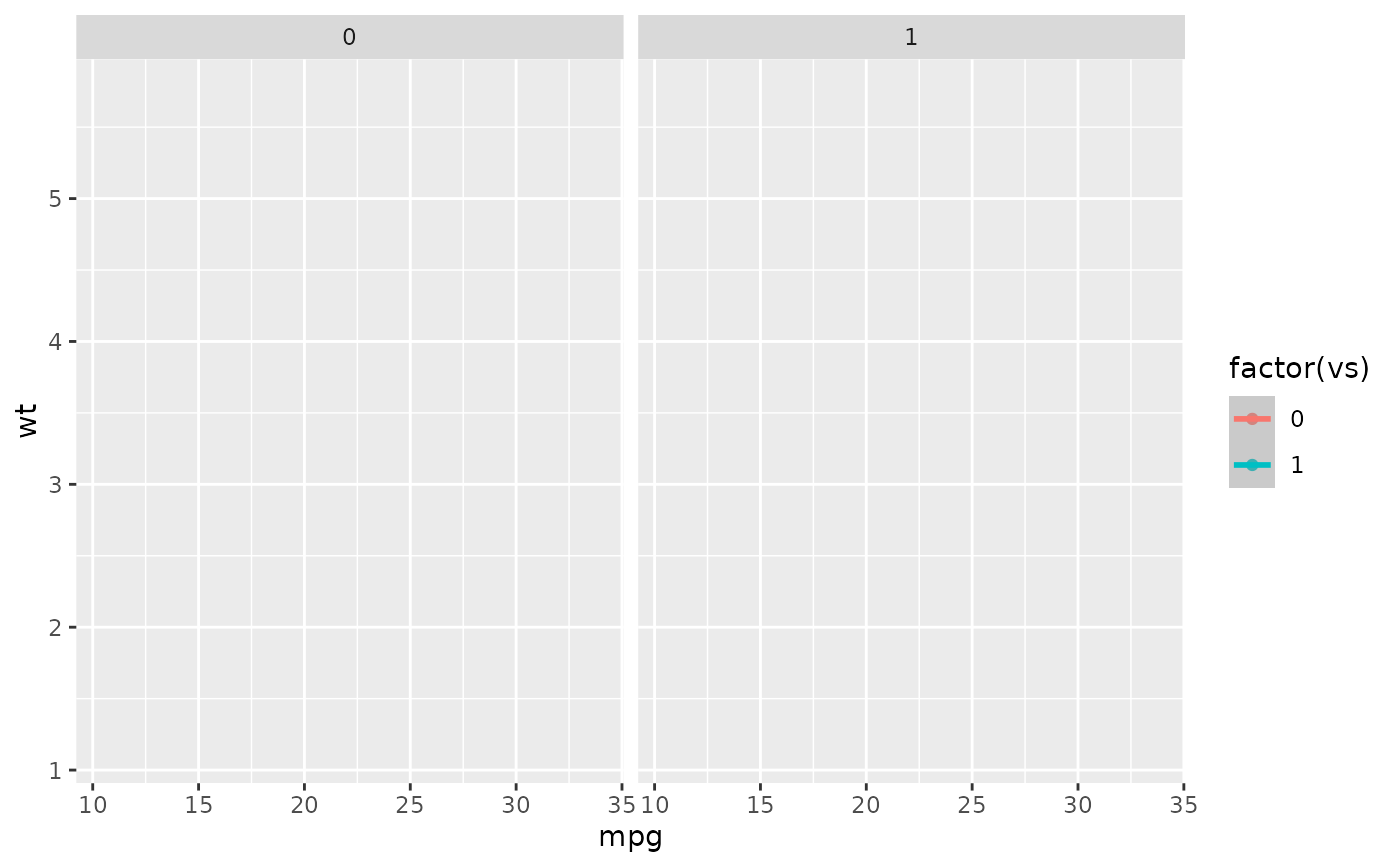
order = c(3, 1), the second layer is not shown.By default, the first plot is blank, showing layout elements (title, legends, axes, etc) but no data. To omit the blank plot, include
-1: e.g.order = c(-1, 3, 1), ororder = -1.
Value
A list of ggplot2 objects, which can be passed to reveal_save()
Examples
# Create full plot
library(ggplot2)
data("mtcars")
p <- ggplot(mtcars,
aes(mpg, wt,
color = factor(vs),
group = factor(vs))) +
geom_point() +
geom_smooth(method="lm",
formula = 'y ~ x',
linewidth=1) +
facet_wrap(~am)
p
 plot_list <- reveal_layers(p)
plot_list[[1]]
plot_list <- reveal_layers(p)
plot_list[[1]]
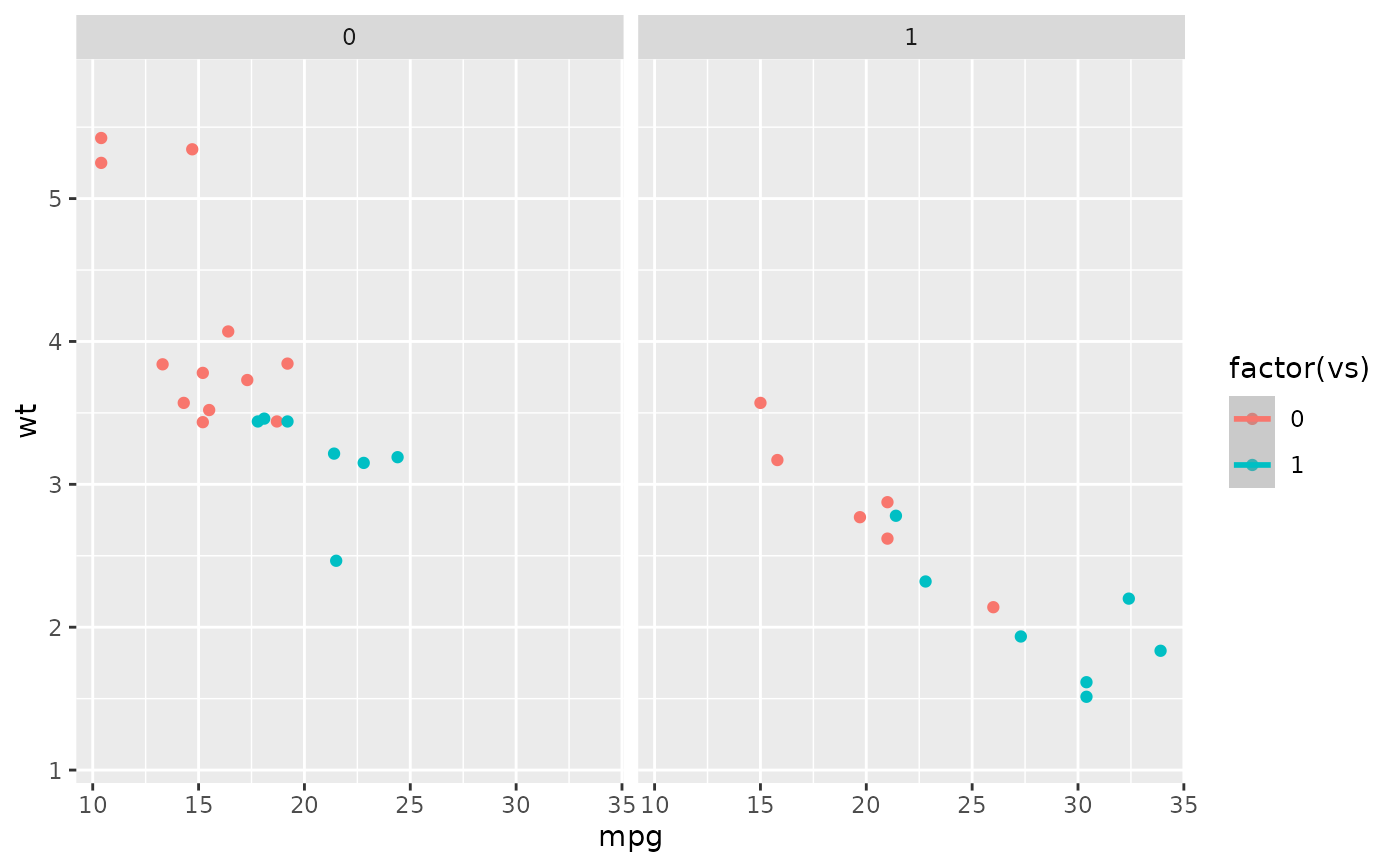
 plot_list[[2]]
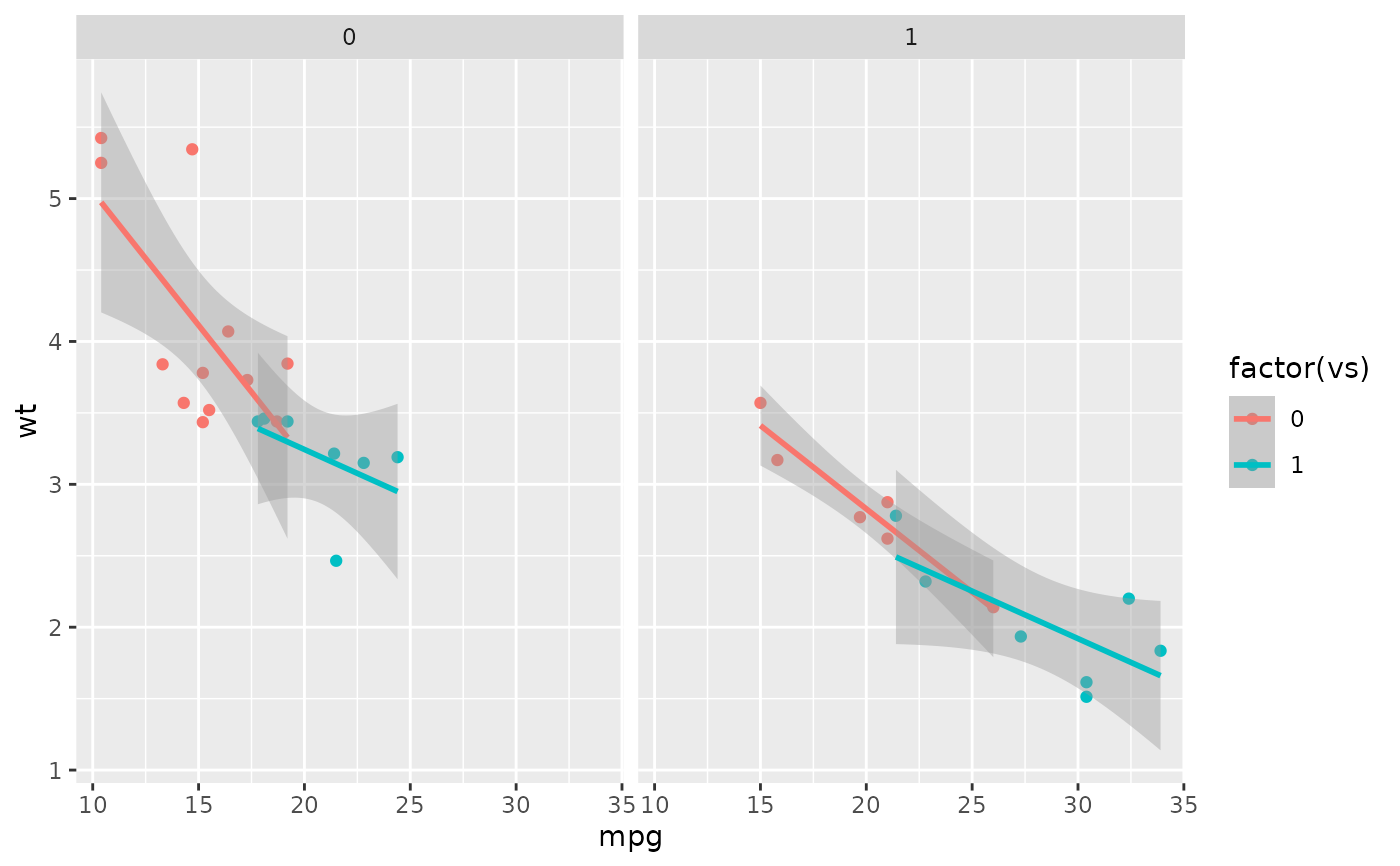
 plot_list[[3]]
 # Save plots
reveal_save(plot_list, "myplot.png", width = 8, height = 4, path = tempdir())
#>
#> ── Saving incremental plots ──
#>
#> ✔ /tmp/RtmpK1FQo1/myplot_0.png
#> ✔ /tmp/RtmpK1FQo1/myplot_1.png
#> ✔ /tmp/RtmpK1FQo1/myplot_2_last.png
# Clean temp files
file.remove(list.files(path = tempdir(), pattern = "myplot", full.names = TRUE))
#> [1] TRUE TRUE TRUE
# Save plots
reveal_save(plot_list, "myplot.png", width = 8, height = 4, path = tempdir())
#>
#> ── Saving incremental plots ──
#>
#> ✔ /tmp/RtmpK1FQo1/myplot_0.png
#> ✔ /tmp/RtmpK1FQo1/myplot_1.png
#> ✔ /tmp/RtmpK1FQo1/myplot_2_last.png
# Clean temp files
file.remove(list.files(path = tempdir(), pattern = "myplot", full.names = TRUE))
#> [1] TRUE TRUE TRUE